Know your numbers without exporting to a spreadsheet.
Because every quote, part, print and payment already lives in one record, the numbers a shop owner actually asks for come out of the same place: what did we make this month, what did we win and lose, what failed and why, and what did it cost.
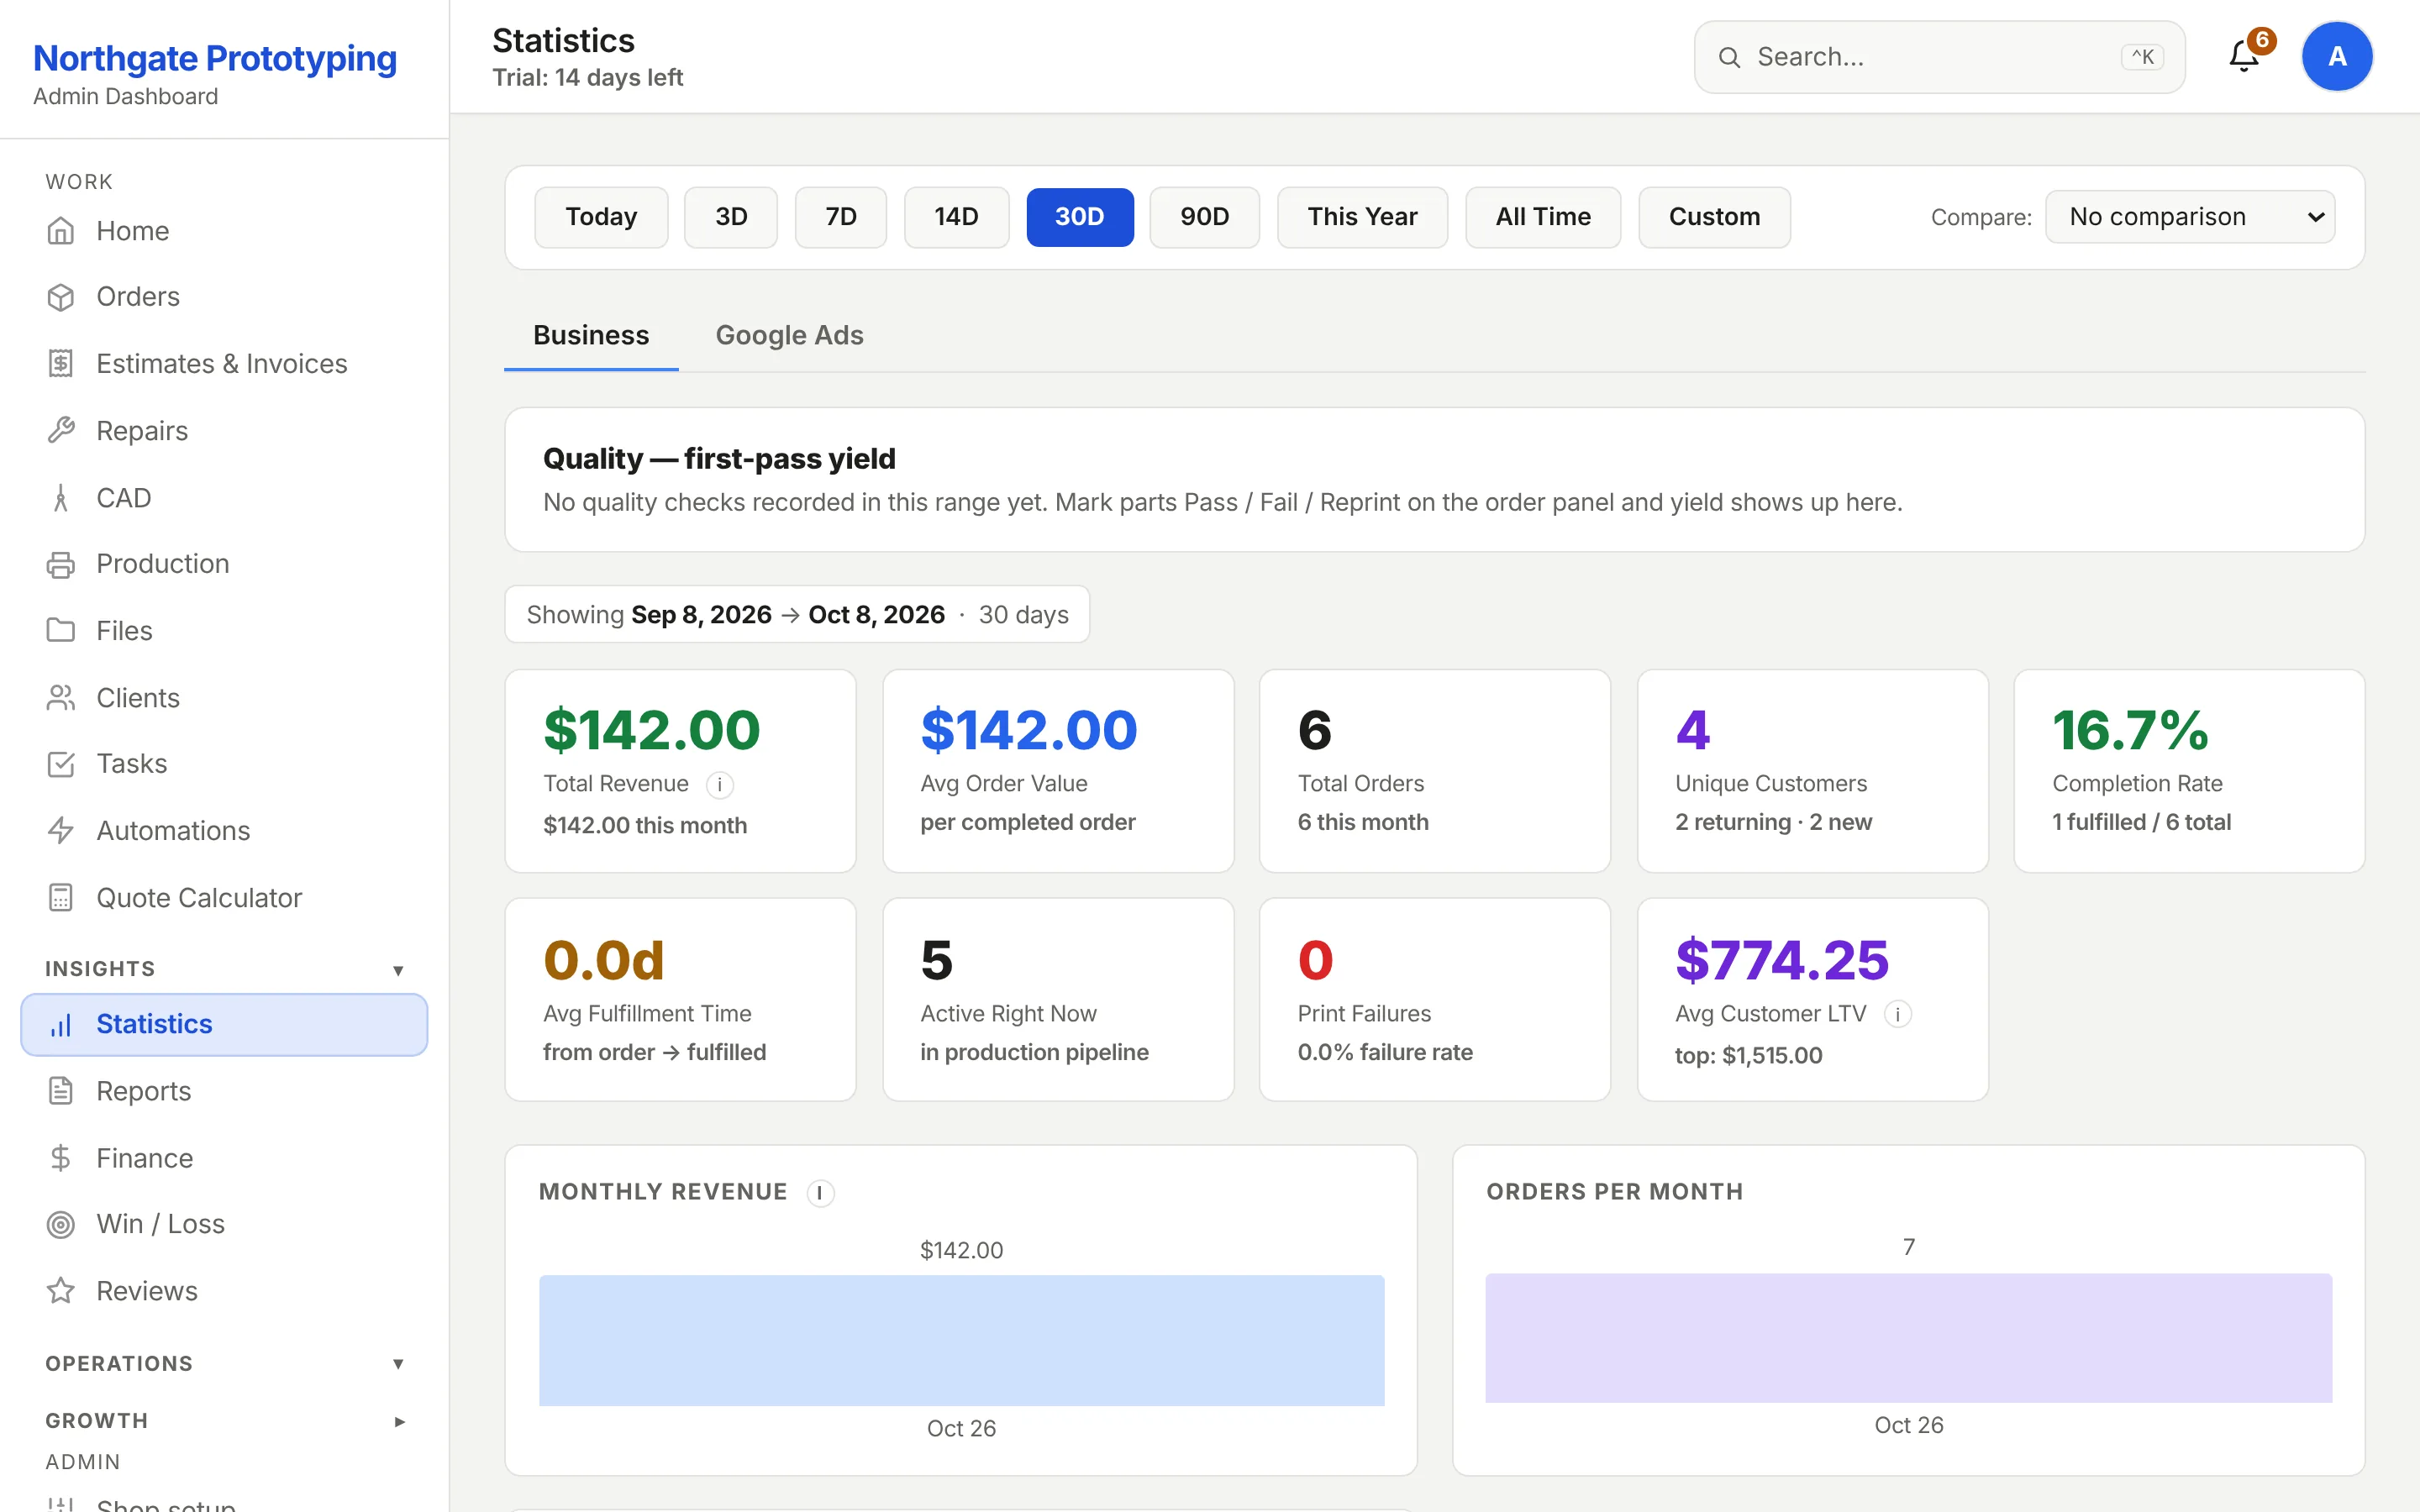
Pick a range from today to all time and compare it with the previous period or the same period last year. Revenue and average order, close rate from decided quotes, first-pass yield from the quality checks your floor records, monthly revenue, parts made per month, and the split by technology and material. The 30-day default is deliberately short, so a single large order cannot hide a slow month.
Any range, with period-over-period or year-over-year comparison
First-pass yield from Pass, Fail and Reprint marks on the order
Parts made per month and revenue by technology
Lifetime value that counts paid work, not open quotes
CloseThe Statistics page with range buttons from Today to All Time, a comparison selector, a quality first-pass yield panel, total revenue, close rate and fulfilment tiles, and monthly revenue and parts-made-per-month charts.
Win / loss
Which prices win, and why the others did not.
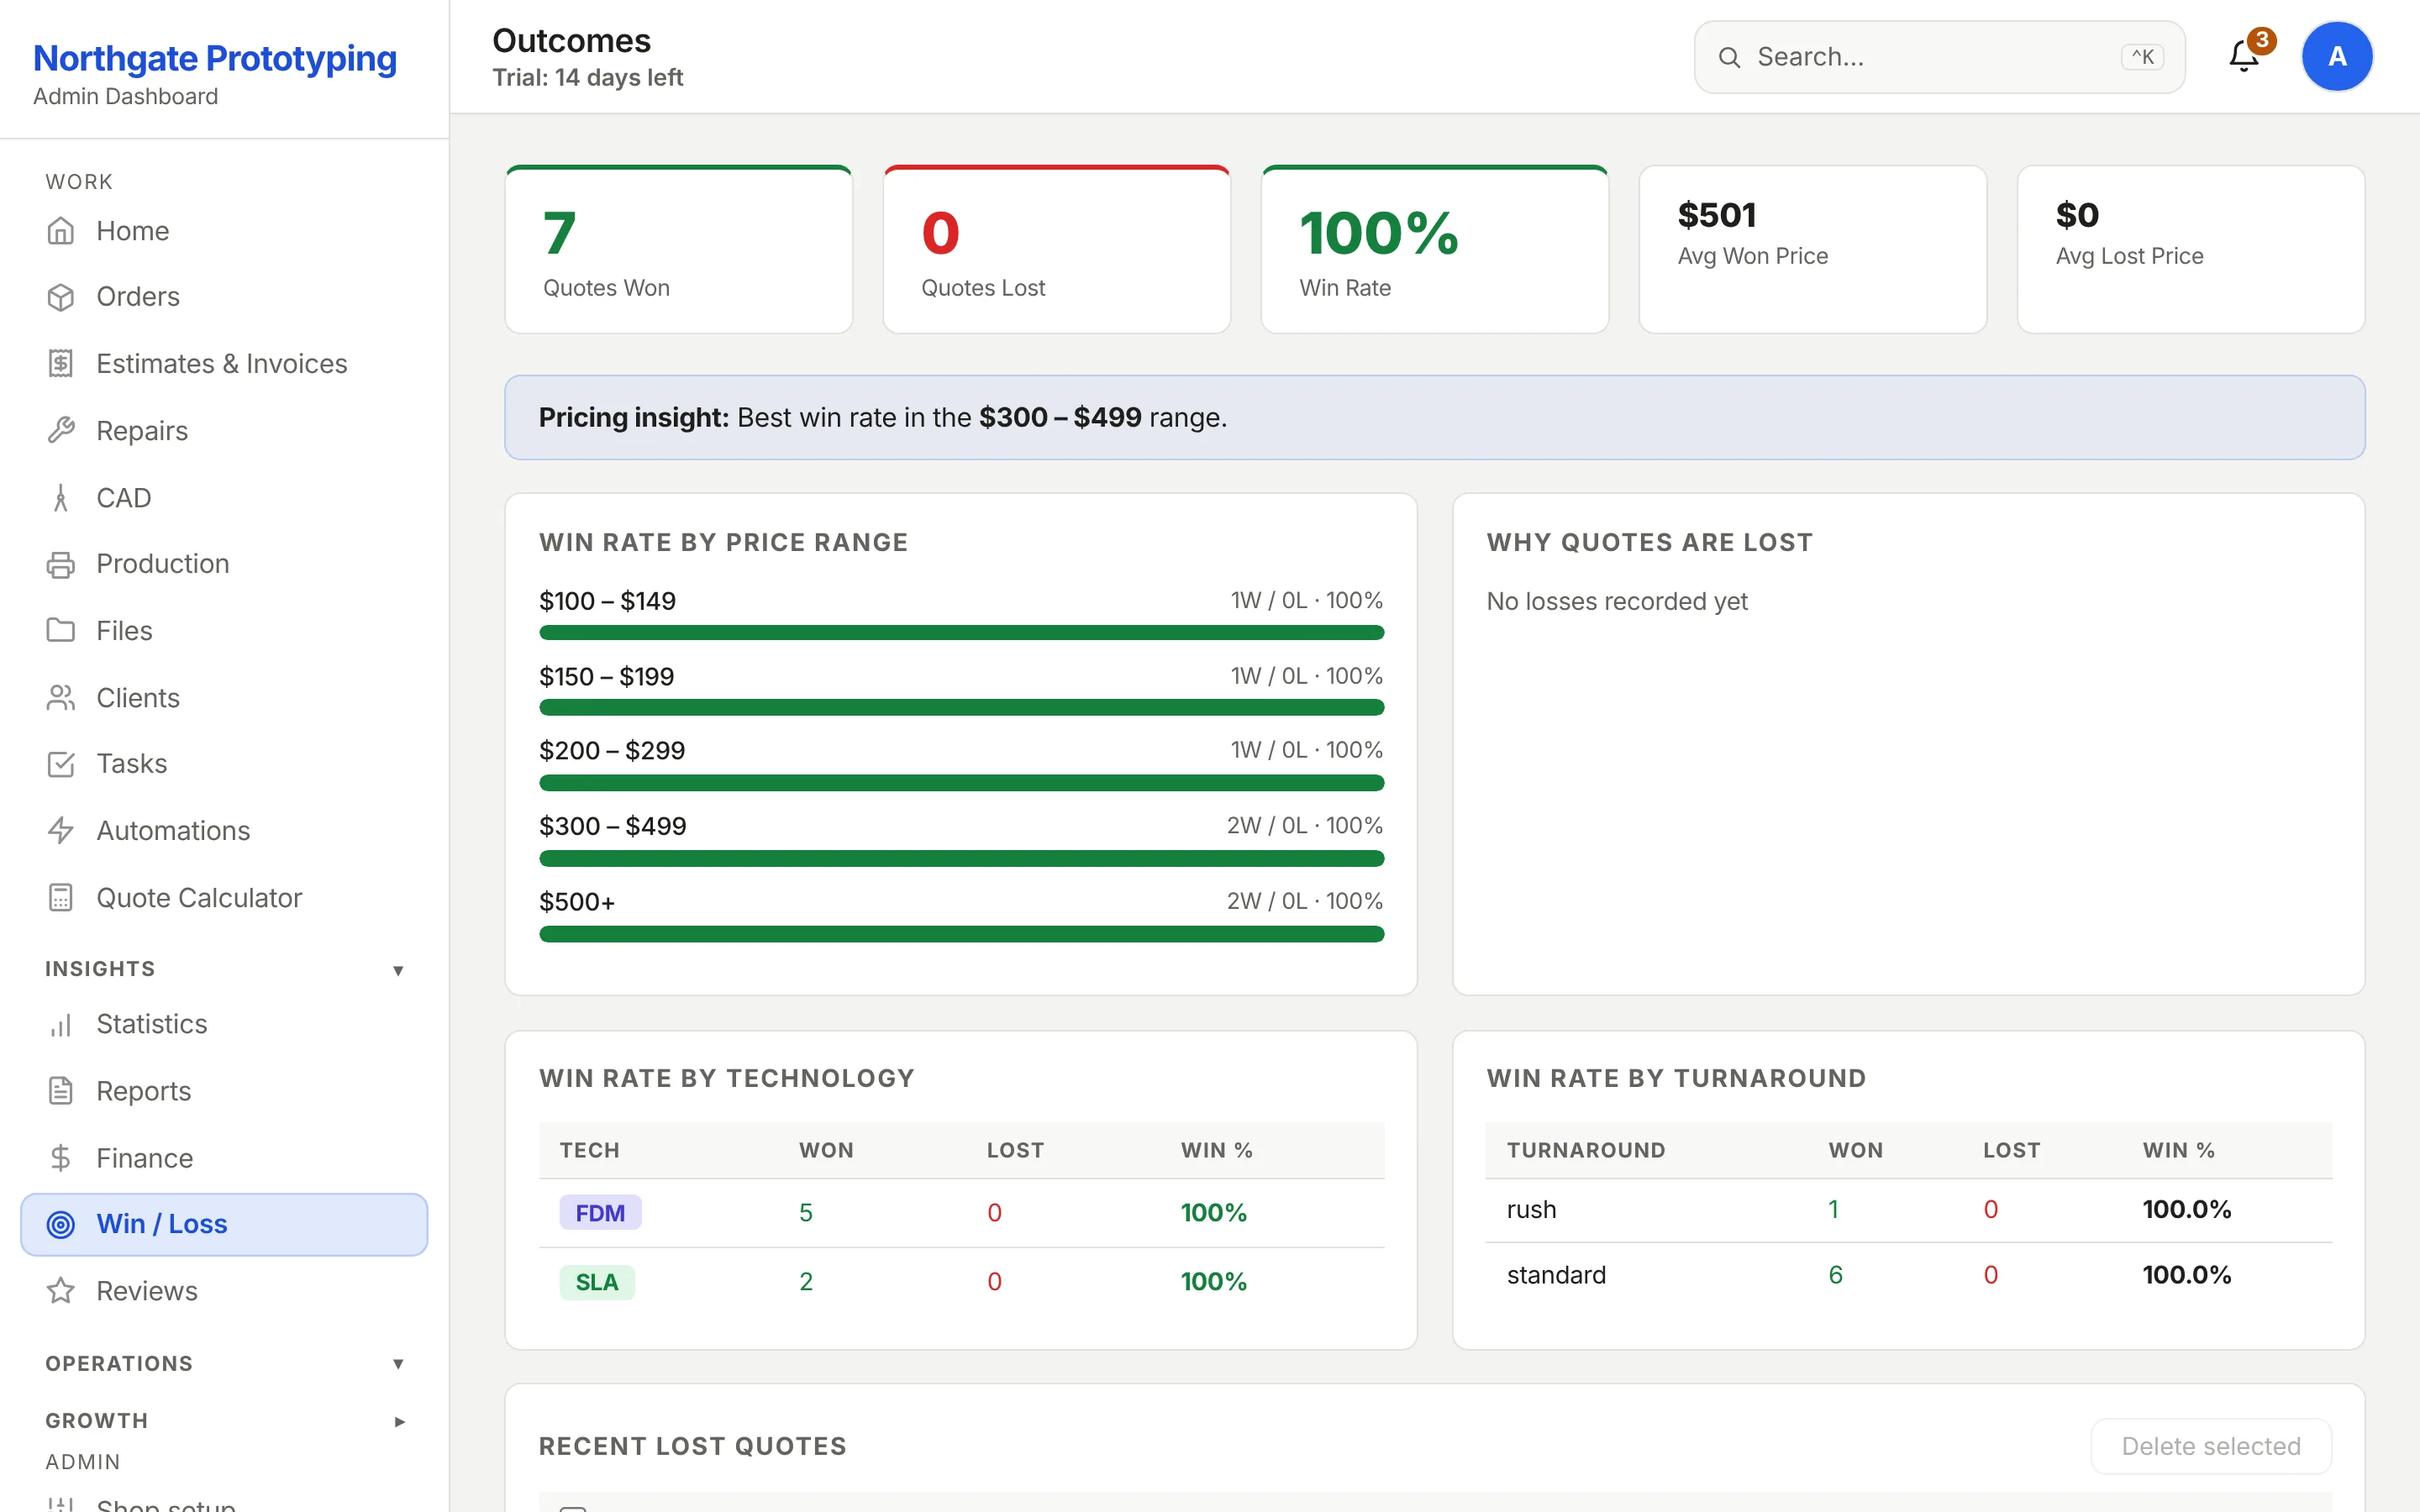
Every quote outcome is recorded with its price band and, for the ones you lost, the reason the customer gave. The page turns that into a win rate by price range, average won and lost prices, and the single insight that matters for the next rate change.
Win rate by price range with the counts behind it
Loss reasons captured when you decline or the customer walks
Feeds the pricing engine's calibration
CloseThe Win/Loss page: quotes won and lost, win rate, average won and lost price, and a win rate by price range table.
Money and failures
Profit, not just revenue. Failures, not just reprints.
Finance
A profit and loss view by year
Revenue from orders, materials and shipping as cost of goods, gross margin, then operating expenses you record: payroll, rent, subscriptions. The number at the bottom is the one your accountant asks for.
Failure analysis
Every failed print with a reason
Mark a print failed and pick the reasons; the page shows failure rate over time, the top reason, and which materials and machines fail most. The Shop Expert reads this history when it answers your troubleshooting questions.
Custom reports
Any metric, any breakdown, any range
Revenue, order count or average order value, broken down by month, status, technology, material, customer or source, over the last 30 days, 90 days, twelve months or all time.
Home
The daily read
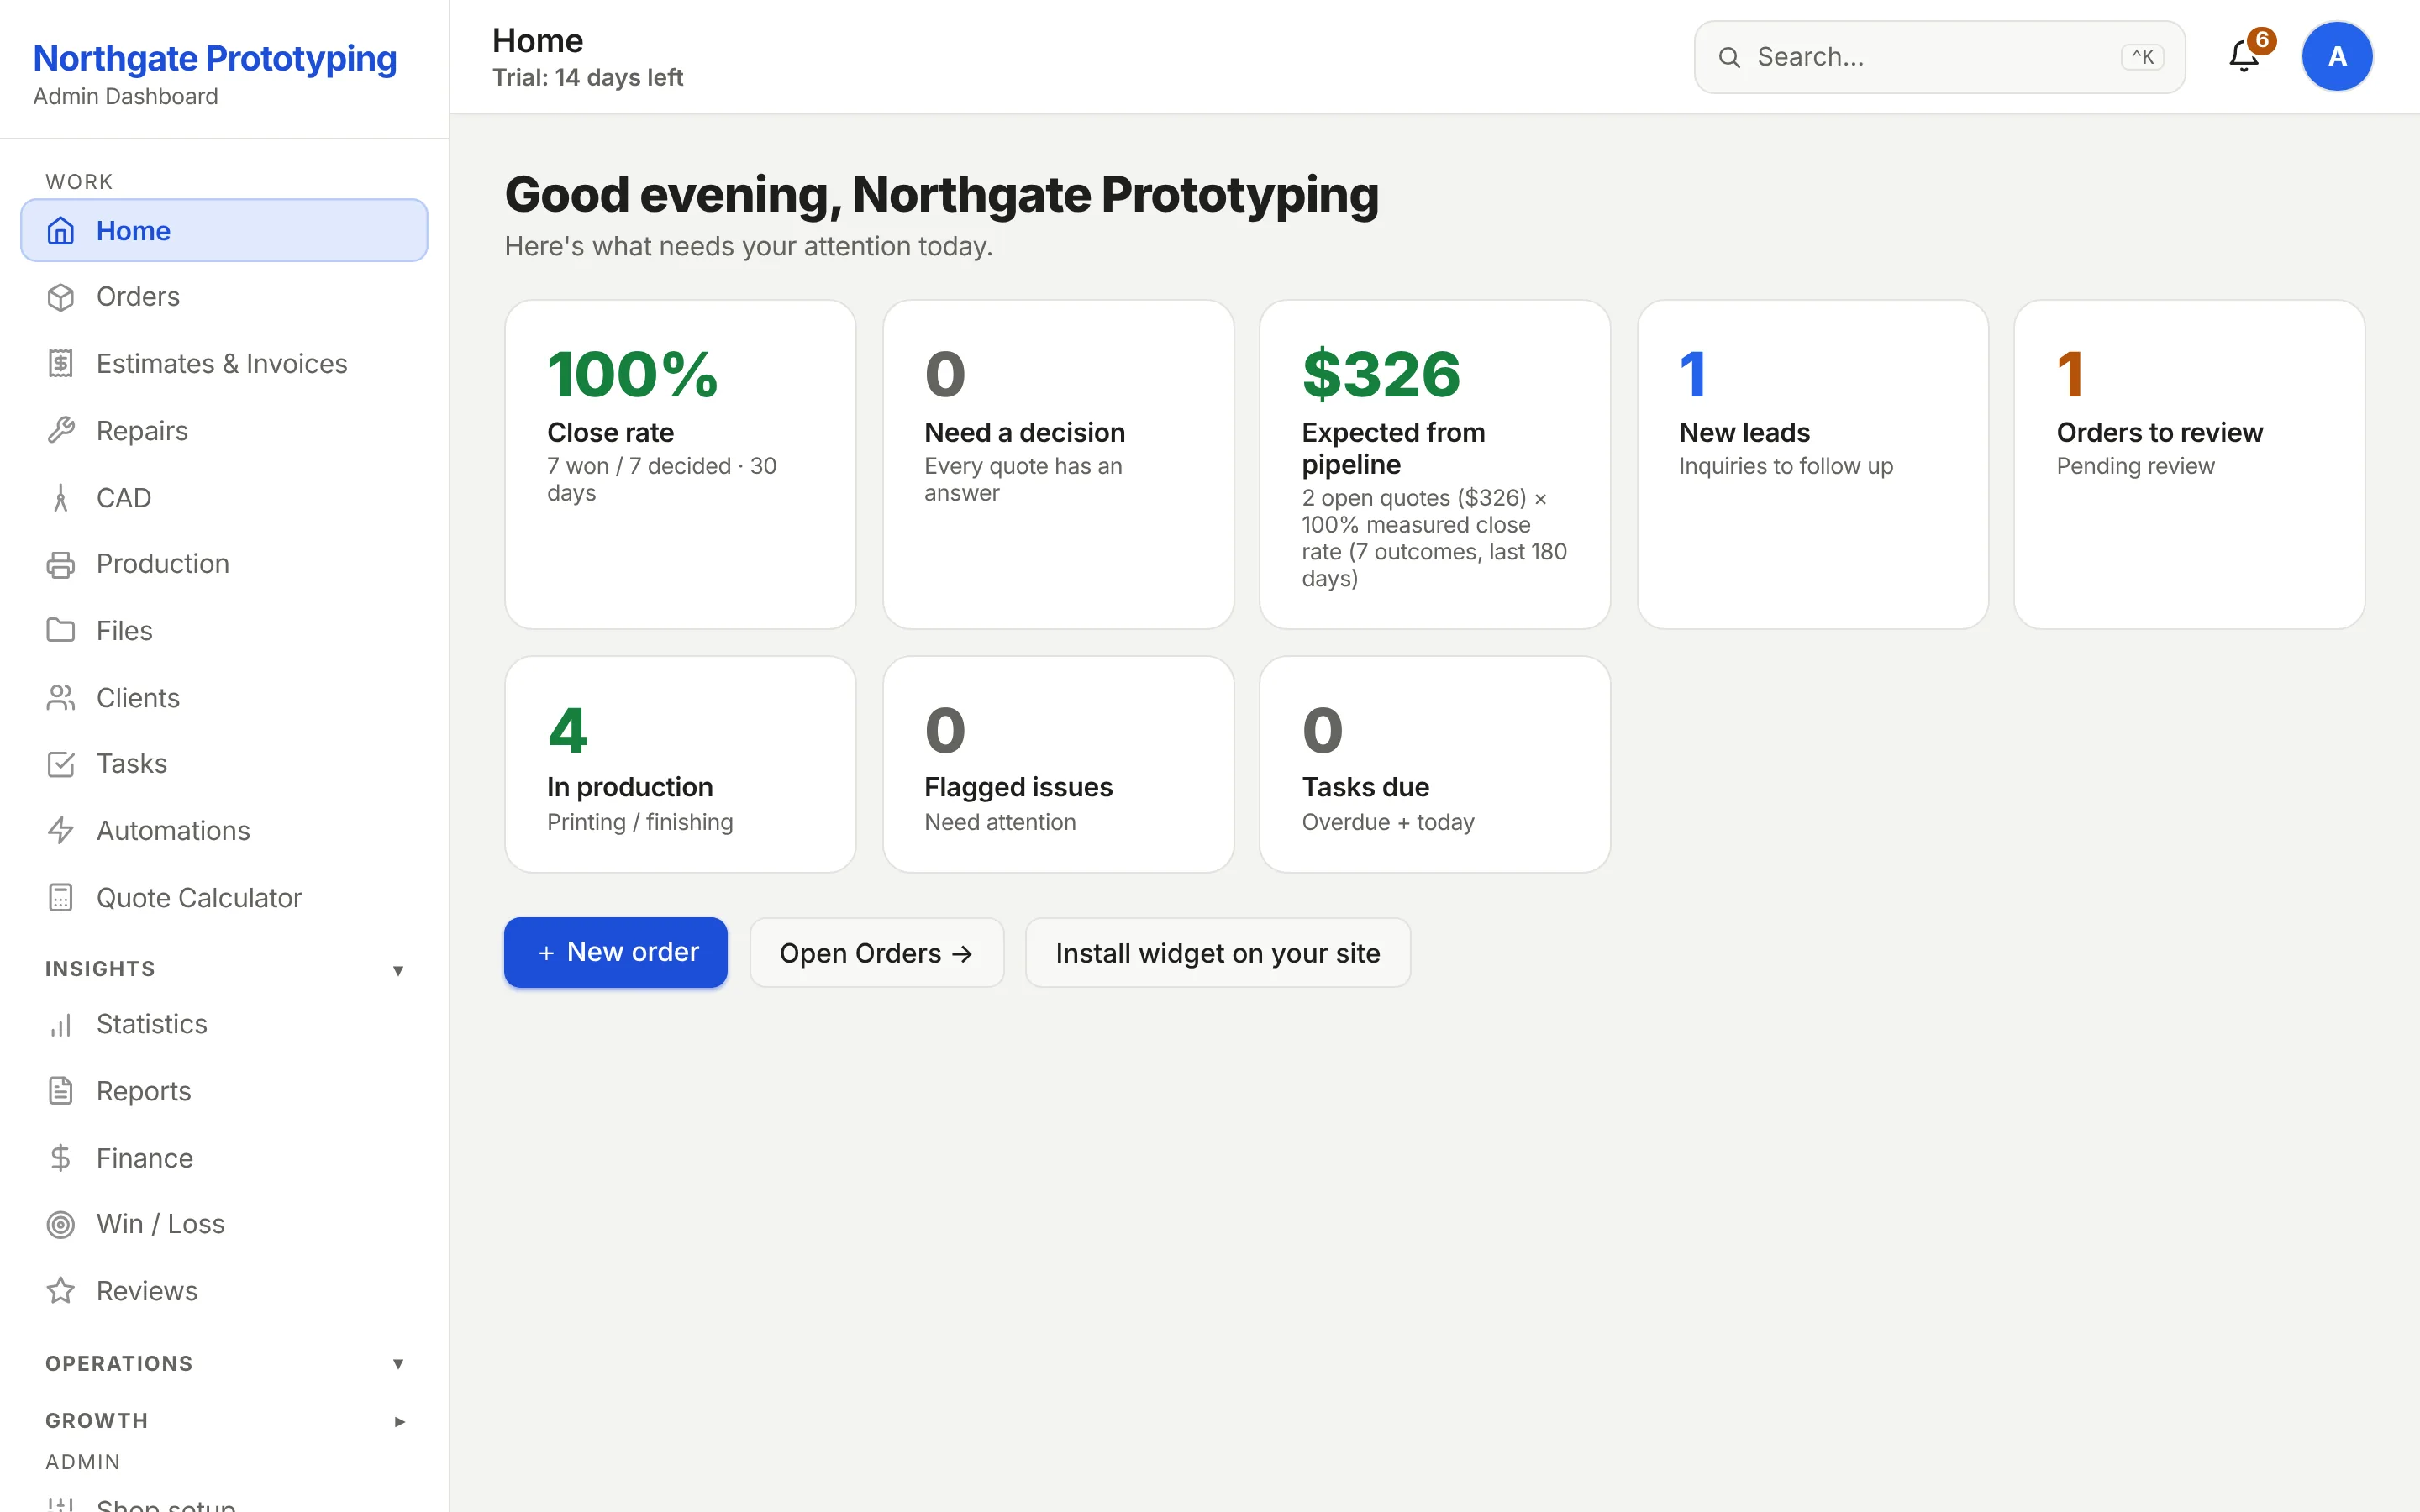
The first screen after sign-in: close rate, quotes needing a decision, expected revenue from the pipeline, new leads, orders to review and jobs in production. Every number is a link to the list behind it.
CloseThe Layers3D home screen for the demo shop: close rate, quotes needing a decision, expected revenue from the pipeline, new leads, orders to review and jobs in production, with quick actions.
See your own numbers within your first two weeks.
Founding Shops get Professional at CA$119.20 a month for their first year. Every quote and order you run through it becomes a data point.